People search "retatrutide results" to see one thing: the numbers. How much weight did it move, how fast, and was it real fat or just water? This guide lays out what the published trials actually reported, from the phase 2 obesity, diabetes, and liver studies to the phase 3 TRIUMPH program, with the timeline, the dose curve, and the responder data. It is a research overview, not medical advice, and not a protocol for human use.
The quick answer: what did retatrutide do?
In the phase 2 obesity trial, the top dose of retatrutide cut about 24% of body weight over 48 weeks. Placebo cut about 2%. In the larger phase 3 TRIUMPH-1 readout, the top doses reached roughly 25% to 28% at 80 weeks, and an extension pushed some participants to about 30%. That was the biggest weight loss any single obesity peptide had reported. This is trial data, not a promise for any one person.
The rest of this guide unpacks those numbers. We will walk the phase 2 obesity trial, the separate diabetes and liver studies, then the phase 3 TRIUMPH program. Along the way we answer the questions people ask most: how fast results show, what happens in the first four weeks, whether it is fat or water, and how it stacks up against semaglutide and tirzepatide.
What is retatrutide, and why do the results look different?
Retatrutide is an experimental weight peptide from Eli Lilly, known in the lab as LY3437943. What sets it apart is how many targets it hits. Semaglutide acts on one hormone receptor. Tirzepatide acts on two. Retatrutide acts on three at once: GLP-1, GIP, and glucagon. That third target, the glucagon receptor, is the new part, and it is a big reason the results ran higher.
The GLP-1 and GIP targets quiet appetite and slow the stomach, so people eat less. The glucagon target does something the others do not: it raises the rate at which the body burns energy and helps move fat out of storage. In plain terms, one arm turns the intake down while another turns the burn up. For a fuller breakdown of the mechanism, see our retatrutide vs semaglutide vs tirzepatide comparison.
- GLP-1: lowers appetite and slows how fast the stomach empties.
- GIP: adds to the appetite effect and may soften nausea.
- Glucagon: raises energy use and helps mobilize stored fat.
- Together, the three push both sides of the balance: less in, more out.
This is also why the article is about results rather than a how-to. Retatrutide is still moving through trials. It is not an approved medicine, and the vials sold for research carry no dosing leaflet. What we can report is what the studies found. If you want the plain compound overview first, our retatrutide dosing overview covers how the trials structured the ramp.
Why is the third receptor the whole difference?
The glucagon receptor is the reason retatrutide reads differently from the drugs before it. Most weight drugs only push intake down. Glucagon pushes energy use up. In human studies, a glucagon signal raised the rate the body burns energy by roughly 15%, on top of any appetite effect. That is a second engine, and retatrutide is the first widely tested obesity drug to run both. This is reported science, not medical advice.
The mechanism has a few known parts. In the liver, the glucagon signal drives fat oxidation and lifts helpful signals like FGF21. In fat cells, it switches on an enzyme called hormone-sensitive lipase, which breaks stored fat down so it can be burned. At the same time it slows the making of new triglycerides. The net effect is a body that both eats less and clears fat faster.
- Raises energy expenditure, seen as roughly a 15% lift in studies.
- Drives fat oxidation in the liver, clearing stored liver fat.
- Switches on lipolysis, breaking stored fat down to burn.
- Slows the making of new triglycerides.
There is direct trial evidence this arm did real work. In the phase 2 study, blood markers of fat burning, such as certain acylcarnitines and ketone-related compounds, rose with dose. A statistical analysis found these fat-burning changes accounted for roughly a quarter of the weight loss in people without diabetes. In other words, a real slice of the result came from burning fat, not just eating less.
What did the phase 2 obesity trial show?
The phase 2 obesity trial was published in the New England Journal of Medicine in 2023 by Jastreboff and colleagues. It enrolled 338 adults with obesity. Each got a weekly injection of retatrutide at 1, 4, 8, or 12 mg, or a placebo, for 48 weeks. The dose started low and stepped up over time. This is the trial most "retatrutide results" headlines are quoting.
At the highest dose, 12 mg, the average weight loss was 24.2% over 48 weeks. For a person starting around 108 kg, that is roughly 26 kg, or about 58 lb. The 8 mg group lost close to 23%. Placebo lost about 2.1%. At the time, that 24% figure was the largest average weight reduction ever reported for an anti-obesity drug in a trial of that length. It was widely called a new bar for the field.
| Phase 2 group | Mean weight loss at 48 weeks | Rough kg on a 108 kg start |
|---|---|---|
| Placebo | ~2.1% | ~2 kg |
| 1 mg | ~8.7% | ~9 kg |
| 4 mg | ~17.1% | ~18 kg |
| 8 mg | ~22.8% | ~25 kg |
| 12 mg | ~24.2% | ~26 kg |
Two details from phase 2 matter for anyone reading the numbers. First, the loss climbed the whole way. There was no clear flattening by week 48, which suggests the endpoint number understated where people might have landed with more time. Second, the effect was orderly. More dose meant more loss, in a clean staircase, which is the sign of a real drug effect rather than noise.
There was also an earlier read at 24 weeks, about halfway through. At that point the top group had already lost up to about 17.5% on average. So even the mid-point number was larger than the full result of the drugs before it. The back half of the year kept adding on top of that.
How many people hit the big numbers?
An average can hide the spread, so the trial also reported responder rates: the share of people who crossed each weight-loss mark. At 12 mg by 48 weeks, 100% lost at least 5%, 93% lost at least 10%, and 83% lost at least 15%. A real slice went past 20% and 25%. That consistency, not just the mean, is what impressed researchers. This is reported trial data.
| Threshold reached by 48 weeks | 12 mg group | 8 mg group |
|---|---|---|
| At least 5% loss | 100% | 100% |
| At least 10% loss | 93% | 91% |
| At least 15% loss | 83% | 75% |
| At least 20% loss | roughly half | fewer |
| At least 25% loss | about a quarter | fewer |
The read here is that the top dose did not just work for a lucky few. Nearly everyone in that arm cleared 10%, a mark that many older weight drugs struggled to average. The 20% and 25% marks, which used to be surgery territory, were reached by a meaningful share on a weekly injection. That is the headline behind the headline.
What did the diabetes trial show?
Obesity was not the only phase 2 study. A separate trial tested retatrutide in adults with type 2 diabetes over 36 weeks. It measured two things at once: blood sugar control and weight. Both moved. Blood sugar, tracked as HbA1c, fell by up to about 2.2%, a large drop. Weight fell by up to about 17% at the top dose. This is reported research, not medical advice.
What makes this trial useful is the comparison arm. It included dulaglutide, an approved GLP-1 diabetes drug, as an active yardstick. On weight, dulaglutide produced about 2% loss, placebo about 3%, and retatrutide up to about 17%. Seeing retatrutide clear an established drug by that margin, in the same study, is stronger evidence than any cross-trial guess.
| Diabetes trial arm | Weight change at 36 weeks | Blood sugar (HbA1c) |
|---|---|---|
| Placebo | ~3.0% loss | Little change |
| Dulaglutide 1.5 mg | ~2.0% loss | Improved |
| Retatrutide (top dose) | ~16.9% loss | Down up to ~2.2% |
People with diabetes are often harder to move on the scale than people without it, because the condition affects how the body handles energy. So a near-17% loss in this group is notable. It also shows the weight effect and the blood-sugar effect travel together, which fits a drug that reworks metabolism rather than only curbing appetite.
The phase 3 diabetes trial, part of the TRIUMPH program, later backed this up at scale. It again reported strong blood-sugar control and substantial weight loss in people with type 2 diabetes. So the diabetes result was not a one-off from a small study. It held up in the larger, longer phase 3 work, which is the test that matters most.
What happened to liver fat?
One of the most striking results did not come from the scale at all. It came from the liver. A phase 2a sub-study looked at people with fatty liver disease, now called MASLD. Retatrutide cut the fat stored in their livers dramatically. At 24 weeks the top doses reduced liver fat by more than 80% on average, and most participants reached a normal liver-fat level. This is reported trial data.
The numbers are worth stating plainly. At 24 weeks, liver fat fell by about 82% at the 12 mg dose, versus almost no change on placebo. Around 86% of the top-dose group reached a normal liver-fat reading of under 5%. By 48 weeks the liver-fat reduction reached roughly 86%. Liver fat is a direct readout of stored fat, not water or appetite, so this is hard to explain any other way.
Why does a weight article care about the liver? Because it is proof of the fat-burning claim. Excess liver fat is one of the clearest signs of stored energy in the wrong place, and it is closely tied to metabolic health. Clearing it that fast points to real fat mobilization, which is exactly what the glucagon target is meant to drive.
What did the phase 3 TRIUMPH trial show?
Phase 2 proved the idea. Phase 3, the TRIUMPH program, tested it at scale. TRIUMPH-1 was the pivotal obesity trial: 2,339 adults with obesity or overweight plus a weight-related condition, but without diabetes. Doses were 4, 9, or 12 mg, escalated from a 2 mg start, or placebo. The main results were read at 80 weeks, far longer than phase 2. This is reported research, not a protocol for human use.
Trials like this report two versions of the number, and it is worth knowing both. The efficacy figure describes people who stayed on the drug as planned. The treatment-regimen figure counts everyone who was assigned to a dose, including those who stopped early, so it is lower. Both are honest ways to measure. Serious science quotes both, so we will too.
| TRIUMPH-1 dose | If taken as planned (efficacy) | All assigned (treatment-regimen) |
|---|---|---|
| Placebo | ~2.2% | ~3.9% |
| 4 mg | ~19.0% | ~17.6% |
| 9 mg | ~25.9% | ~23.7% |
| 12 mg | ~28.3% | ~25.0% |
There is also an extension detail worth flagging. A group of participants with more severe obesity who tolerated their dose were escalated to the maximum tolerated dose and followed to 104 weeks. In that group, average loss reached up to about 30%. So the ceiling in the studies was not a fixed number. It kept moving with dose and time.
A companion phase 3 trial, TRIUMPH-4, studied adults who had both obesity and painful knee osteoarthritis over 68 weeks. The 12 mg group lost about 28.7% of body weight and also reported meaningful relief from joint pain. That is a useful data point because it shows the weight result holds up in a different, harder-to-treat group.
- TRIUMPH-1: about 25% to 28% mean loss at 80 weeks at the top doses.
- Placebo landed near 2% to 4%, so the gap was large.
- An extension to 104 weeks reached up to about 30% in a subgroup.
- TRIUMPH-4 (obesity plus knee OA): about 28.7% at 12 mg over 68 weeks.
What is the full TRIUMPH program?
TRIUMPH is not a single trial. It is a family of phase 3 studies, each aimed at a different group or question. TRIUMPH-1 is the core obesity trial. Others test retatrutide in people with type 2 diabetes, in specific health conditions, and over the long run for hard outcomes like heart events. Together they build the full case a regulator needs. This is reported program structure.
| TRIUMPH trial | Who it studies | What it asks |
|---|---|---|
| TRIUMPH-1 | Adults with obesity, no diabetes | Core weight-loss result |
| TRIUMPH-2 | Adults with obesity and type 2 diabetes | Weight plus blood-sugar control |
| TRIUMPH-3 | Obesity with high cardiovascular risk | Weight in a higher-risk group |
| TRIUMPH-4 | Obesity with knee osteoarthritis | Weight plus joint-pain relief |
| Outcomes trial | Long-term follow-up | Hard health events over years |
Why does the program shape matter for reading results? Because a single trial only tells you about one group. A program tells you whether the effect holds across many. The early TRIUMPH readouts all pointed the same way: large, dose-linked weight loss with the expected stomach side effects. The long outcomes work, which asks whether the loss prevents heart events, takes years and is still ongoing.
What is retatrutide being studied for?
People also search "retatrutide uses," so it helps to lay out the map. Retatrutide is being tested across a handful of linked conditions, all tied to metabolism. The common thread is that each one improves when body fat and energy handling improve. This is a list of what the trials study, not a list of approved uses. Retatrutide is still an investigational compound.
| Condition studied | What the research looked at |
|---|---|
| Obesity | The core weight-loss result |
| Type 2 diabetes | Weight plus blood-sugar control |
| Fatty liver (MASLD/MASH) | Clearing fat stored in the liver |
| Obesity with knee osteoarthritis | Weight plus joint-pain relief |
| Cardiovascular risk | Long-term heart outcomes, still ongoing |
The spread is the story. A drug that helps obesity, diabetes, fatty liver, and joint pain at once is acting on a shared root, not four unrelated problems. That is what a broad metabolic drug looks like in the data. It is also why the program is so large: each use needs its own trial before any of it becomes an approved label.
How quickly do you see results with retatrutide?
In the studies, appetite tended to quiet within the first days. The scale usually started moving in the first few weeks. But the big numbers were slow. Real loss built across 24 to 80 weeks, and the curve kept falling the whole way. Retatrutide is a marathon in the data, not a sprint. This is reported research, not a prediction for any person.
The reason for the slow start is the ramp. Every trial began at a low dose and stepped up every few weeks. That design is on purpose: a slow climb keeps the stomach settled and lowers the chance of a person dropping out from nausea. The trade-off is that the first month or two runs at doses well below the ones that drove the headline results.
| Time point | What the trials tended to show |
|---|---|
| First week | Appetite quiets; little scale change yet |
| Weeks 2 to 4 | A few percent of loss on the starter dose |
| Weeks 8 to 12 | Loss accelerates as the dose climbs |
| Weeks 24 to 48 | The bulk of the loss accumulates |
| Weeks 48 to 80 | Loss deepens further, still no clear plateau |
So the honest answer to "how fast" is two-sided. You can see the first signs early, within weeks, mostly as a quieter appetite and a small dip. But the result people picture, the 20-plus percent, took the better part of a year in the trials. For the money side of that timeline, our retatrutide cost breakdown shows what a long run adds up to.
A month-by-month look at the results
It helps to map the loss to a rough calendar, using the top-dose curve from the trials. The early months are gentle, the middle months are the steep part, and the later months keep adding at a slower pace. These are approximate averages from the study curve, not targets, and every person differs. This is reported trial data, not a protocol for human use.
| Rough month | Approx cumulative loss (top dose) | What is happening |
|---|---|---|
| Month 1 | ~2% to 4% | Starter dose; appetite changing |
| Month 3 | ~7% to 10% | Dose climbing; loss speeds up |
| Month 6 | ~13% to 17% | The steep middle of the curve |
| Month 9 | ~18% to 22% | Still falling steadily |
| Month 12 | ~22% to 26% | Near the phase 2 endpoint |
| Month 18 to 24 | ~26% to 30% | Phase 3 and extension territory |
The pattern is the point. Someone judging the drug at month one sees almost nothing and might quit. Someone who reads the whole curve sees why patience mattered in the studies. The loss compounded. Each month built on the last, and the biggest single stretch of loss came in the middle of the year, not at the start.
How much weight can research subjects lose in 4 weeks?
Not much, and by design. In the trials, the first four weeks sat at the lowest starter dose, often 2 mg or below. Average weight change over that window was small, usually a few percent at most. The first month was about tolerance and appetite, not about the scale. The large numbers came later, at higher doses over many months. This is reported trial structure, not a protocol for human use.
This matters because a lot of online expectations are set wrong. Someone reads "24%" and pictures it in a month. In the data, a month is barely the warm-up. Judging retatrutide by four weeks is like judging a savings plan by the first deposit. The compounding is the point, and it happens over quarters, not weeks.
- Ran the lowest dose to let the stomach adjust.
- Quieted appetite, which set up the later loss.
- Produced a small scale change, not the headline number.
- Built the tolerance needed to reach the doses that worked.
What were retatrutide results at 1 month?
One month lines up with the same starter-dose window. In the trials, the average loss at roughly four weeks sat in the low single digits of percent. The value of month one was not the number on the scale. It was the fact that appetite had changed and the body had tolerated the drug well enough to keep climbing. That is what made the bigger later loss possible.
It also helps to compare month one across doses. Because everyone started low, the one-month numbers looked similar no matter which final dose a person was assigned to. The groups only pulled apart later, once the doses separated. So an early result tells you very little about where a given arm would finish. The staircase only shows up with time.
Do the results depend on the dose?
Yes, strongly, and this is one of the clearest findings. Across both phase 2 and phase 3, more weekly dose meant more average loss, in a clean order. That dose-response is a hallmark of a real effect. It also means the headline 24% or 28% figures belong to the top doses, not to every dose. A 4 mg arm landed well below a 12 mg arm.
| Weekly dose band | Where the loss tended to land |
|---|---|
| Low (about 1 to 4 mg) | Meaningful but modest, roughly 9% to 19% |
| Middle (about 8 to 9 mg) | Strong, roughly 23% to 26% |
| High (about 12 mg) | Largest, roughly 24% to 28% and up |
The practical read is that the dose is the dial. In the studies, pushing the dose up pushed the loss up, with the trade that stomach side effects also rose at the top. That is the balance the trials were mapping. For how those effects tracked with dose, see our retatrutide side effects guide, which lays out the pattern step by step.
How did the trials build the dose?
The dose did not start at the top. Every trial began low and climbed in steps, a design called titration. In the phase 3 obesity trial, dosing began at 2 mg and stepped up roughly every four weeks toward the assigned target of 4, 9, or 12 mg. The slow climb is the whole reason results built over months instead of arriving at once. This is reported trial structure, not a protocol for human use.
The ramp exists for one reason: the stomach. Starting high would cause too much nausea and push people to quit. Starting low lets the body adjust, so more people reach and hold the doses that drove the big loss. Reading a results curve without knowing the ramp is a mistake, because the early flat stretch is the titration, not a sign the drug is weak.
| Rough stage | Approx dose in the trials | What it was for |
|---|---|---|
| Weeks 1 to 4 | ~2 mg | Let the stomach adjust |
| Weeks 4 to 12 | Stepping up every ~4 weeks | Climb toward the target |
| Weeks 12 and on | Assigned target held | Where the big loss accrued |
This is why comparisons between people can mislead if they ignore where each was in the ramp. Two research subjects at week eight might sit at very different doses depending on how their step-up went. The trials handled this by reporting group averages over fixed time points. It is the fair way to read a titrated drug.
Does retatrutide actually burn fat?
Yes, the data points that way, and this is where retatrutide separates from a pure appetite drug. The glucagon target raises energy use and helps pull fat out of storage. On top of the appetite effect from GLP-1 and GIP, that adds a real push on the burn side. Body-composition scans in the studies showed the weight that came off was mostly fat mass. This is research data, not medical advice.
The clearest sign of a fat effect was the liver result above: liver fat fell by more than 80% at the top doses, which cannot be explained by eating less alone. Waist size also fell alongside weight, tracking the fat carried around the middle. Add the glucagon biology, and the picture is consistent: this drug moves fat, not just the number on a scale.
- The glucagon target raises energy expenditure and fat mobilization.
- Body-composition scans showed loss was mostly fat mass.
- Liver fat dropped by more than 80% at the top doses.
- Waist size fell alongside weight, tracking belly fat.
So "does it burn fat" has a cleaner answer than most weight drugs can give. Many work mainly by making you eat less. Retatrutide does that too, but it adds a metabolic arm that acts on fat directly. That combination is the whole reason the numbers ran higher than the single- and double-target drugs before it.
Is it just water weight?
No, the sustained loss was mostly fat. A small early dip can include some fluid, as with almost any fast change in eating. But water loss is a one-time event. It cannot explain a scale that keeps falling for months. In the trials, the loss deepened across 48 to 80 weeks, and body-composition measurement showed it was fat coming off, not water. This is reported trial data.
There is a simple logic test here. If a result were water, it would show up fast and then stop. The retatrutide curve did the opposite: slow at first, then deeper and deeper over a year. Water does not behave that way. Fat loss over a sustained calorie gap does. The shape of the curve is itself evidence against the water-weight idea.
What happened to fat versus muscle?
Any large weight loss takes off some lean tissue along with fat. That is true of diets, surgery, and every drug in this class. What the body-composition data showed for retatrutide is that the majority of the loss was fat, with the fat share of the loss running high. The goal in the research world is to keep as much of the loss as fat as possible.
This is the same pattern seen across the GLP-1 family, and it is why researchers pair these studies with an interest in protein intake and resistance training. Those protect lean mass during a fast loss. None of that is a human protocol here; it is the research context. For the broader family, our peptides for fat loss overview puts retatrutide next to its cousins.
| What comes off | How the data read it |
|---|---|
| Fat mass | The large majority of the loss |
| Lean mass | A smaller share, as in all big weight loss |
| Waist circumference | Fell alongside weight, tracking belly fat |
| Liver fat | Dropped by more than 80% in the sub-study |
Does the weight loss plateau?
This is one of the most striking parts of the data. In phase 2, at 48 weeks, the curve had not clearly flattened. It was still falling at the endpoint. That is unusual. Most weight-loss curves bend toward a plateau well before a year. Retatrutide, at the top dose, looked like it still had room to go when the study ended.
Phase 3 tested longer, out to 80 weeks and beyond in the extension, and the loss kept building toward the roughly 28% to 30% range. So the practical read is that the plateau, if there is one, came later than usual. That does not mean loss is infinite; every drug has a ceiling. It means the ceiling in the studies sat higher and arrived later than the class had shown before.
- Phase 2 loss was still deepening at week 48, no clear flattening.
- Phase 3 kept building through 80 weeks toward the high 20s percent.
- The extension reached up to about 30% by 104 weeks in a subgroup.
- The ceiling arrived later than other drugs in the class.
What else improved besides weight?
The scale was the headline, but the trials tracked more than weight. Because retatrutide changes metabolism broadly, several markers moved with the loss. In the obesity trials, blood pressure, waist size, blood sugar markers, and blood fats tended to improve. In the diabetes study, blood sugar control improved on top of the weight effect. This is reported trial data, not a claim of treatment.
| Marker tracked | Direction in the trials |
|---|---|
| Waist circumference | Down, tracking belly fat |
| Blood pressure | Lower on average |
| Blood sugar (HbA1c in the T2D study) | Improved, down up to ~2.2% |
| Liver fat (MASLD sub-study) | Down by more than 80% |
| Joint pain (TRIUMPH-4) | Meaningful relief reported |
The osteoarthritis result deserves a note. TRIUMPH-4 was not only a weight trial; it measured knee pain in people who carried both obesity and joint disease, and it found real pain relief alongside the weight loss. That is the kind of secondary result that tells you the weight effect is doing downstream work, not just moving a number.
What happened to blood pressure, cholesterol, and blood sugar?
The phase 2 trial tracked a full set of cardiometabolic markers as exploratory endpoints, and they moved in the healthy direction with dose. Systolic and diastolic blood pressure fell. Triglycerides, LDL cholesterol, and total cholesterol dropped. Fasting glucose and insulin improved, and so did HbA1c. This is reported trial data, not a claim of treatment.
| Cardiometabolic marker | Direction with dose | Why it matters |
|---|---|---|
| Systolic blood pressure | Lower | Eases strain on the heart |
| Diastolic blood pressure | Lower | Part of the same benefit |
| Triglycerides | Lower | A blood fat tied to metabolic risk |
| LDL and total cholesterol | Lower | Standard heart-risk markers |
| Fasting glucose and insulin | Improved | Signs of better insulin use |
| Uric acid | Lower | Relevant to gout and metabolic health |
Two of these deserve a note. Uric acid, the compound behind gout, tended to fall, which is a useful signal for a group that often carries high levels. And the improvement in fasting insulin points to better insulin sensitivity, meaning the body handled sugar more efficiently. A deeper analysis of blood metabolites found retatrutide shifted markers linked to insulin resistance in the healthy direction.
The pattern to notice is that these gains rode along with the weight loss and the dose. That is what you expect from a drug reworking whole-body metabolism, not one nudging a single lever. It is also why the long-term TRIUMPH outcomes trial matters: it asks whether all these marker gains add up to fewer real heart events over years. This is still being studied.
How do the results compare to semaglutide and tirzepatide?
The simplest way to place retatrutide is against the two drugs before it. Semaglutide, the single GLP-1 drug, produced roughly 15% average loss in its pivotal obesity trial. Tirzepatide, the dual GLP-1 and GIP drug, reached up to about 21% to 23% at its top dose. Retatrutide, with the third glucagon target, reached about 24% in phase 2 and the high 20s in phase 3.
| Drug | Targets | Peak trial weight loss |
|---|---|---|
| Semaglutide | GLP-1 only | ~15% |
| Tirzepatide | GLP-1 + GIP | ~21% to 23% |
| Retatrutide | GLP-1 + GIP + glucagon | ~24% (ph2), high 20s (ph3) |
The pattern lines up with the biology. Each added target added loss. That said, these are separate trials with different people, so the comparison is a guide, not a head-to-head. Still, the direction is consistent and large. For a deeper look, our three-way comparison and our semaglutide vs tirzepatide guide break the differences down further.
How do the results compare to weight-loss surgery?
For years, the only reliable way to lose a quarter of body weight was surgery. A gastric sleeve or bypass typically produces roughly 25% to 35% loss. Retatrutide, at the top dose over a year-plus, reached the high 20s and up toward 30% in an extension. So the trial numbers landed inside the low end of the surgery range, on a weekly injection. This is reported research, not medical advice.
| Approach | Typical weight loss | Notes |
|---|---|---|
| Diet and exercise alone | ~5% to 10% | Hard to sustain long-term |
| Semaglutide | ~15% | Single-target injection |
| Tirzepatide | ~21% to 23% | Dual-target injection |
| Retatrutide (trials) | ~24% to 30% | Triple-target injection |
| Bariatric surgery | ~25% to 35% | A surgical procedure |
The comparison is not perfect. Surgery is a one-time procedure with its own long track record, while retatrutide is a drug that works while it is taken and is still in trials. But the headline is real: a medicine reached loss that used to require an operation. That is why the phase 2 result was called a new bar, and why the phase 3 numbers drew so much attention.
What about before-and-after expectations?
Search interest for "retatrutide before and after" is high, so it is worth setting honest expectations. In the trials, a before-and-after over a full year at the top dose meant roughly a quarter of body weight gone, mostly from fat, with a smaller waist and better metabolic markers. That is a large visible change, but it took a year of steady dosing. This is research data, not a prediction for any person.
The trap in reading before-and-after photos is the missing middle. A photo shows the start and the end, not the twelve months of slow change between them, and not the dose or the compound quality behind it. The trial curve is the honest version of a before-and-after: gradual, dose-linked, and built on a known, pure drug. Anything else is a story without its data.
- Roughly 24% to 28% of body weight over a year-plus at the top dose.
- Mostly fat, with a smaller waist and lower liver fat.
- Built slowly, month by month, not in a few weeks.
- Tied to continued dosing, not a one-time reset.
What about the Reddit and real-world results?
Search interest for "retatrutide results Reddit" is high, so it is worth being straight. Community posts and before-and-after photos are anecdotes. They are not trial data. They can be useful for a feel of how people talk about a compound, but they carry no controls, no verified doses, and no way to confirm what was actually in a given vial. Treat them as stories, not evidence.
There is also a real risk buried in the anecdote pile. Gray-market vials vary wildly in purity and identity. A person posting a poor result may have used an underdosed or off-spec product, and a person posting a dramatic one may have used something else entirely. Without a Certificate of Analysis, an anecdote cannot even confirm the compound. That is the whole case for lab-tested material.
- Trial data is controlled; forum posts are not.
- Doses and purity in anecdotes are usually unverified.
- A bad or fake vial can fake either a good or a poor result.
- Only a Certificate of Analysis confirms what a vial actually holds.
Who lost the most in the trials?
Averages hide a spread. Inside every arm, some people lost far more than the mean and some less. In the top-dose groups, a large share crossed the 20% and even 25% marks, which is remarkable for a drug. The extension data showed that people who could tolerate and hold the highest dose tended to reach the deepest loss, up toward 30%.
Two things separated the biggest responders in the data. One was dose: reaching and holding a high dose mattered. The other was time: staying in the study longer meant more loss, because the curve kept falling. Neither is a human instruction; both are simply what the numbers showed about where the largest results came from.
What were the trade-offs in the data?
No result comes free, and honest reporting shows both sides. Retatrutide raised the same stomach effects as the rest of the class, and they rose with dose. It also nudged resting heart rate up a little, a class effect that trials watch. And some people stopped early, which pulls the all-assigned number below the taken-as-planned number. This is reported trial data, not medical advice.
| Trade-off seen in the trials | How it shaped the results |
|---|---|
| Nausea and stomach effects | Most common; rose at the top dose |
| Small heart-rate rise | A class effect, tracked in the studies |
| Early discontinuation | Lowers the all-assigned average |
| Slow ramp needed | Delays the big loss to later months |
The phase 3 numbers put figures on the stomach effects. At the top 12 mg dose, nausea was reported by roughly 42% of participants, diarrhea by about 32%, constipation by about 26%, and vomiting by about 25%. Most were mild to moderate and eased over time. Discontinuation from side effects rose with dose, from about 4% at the low dose to about 11% at the top, versus about 5% on placebo.
These trade-offs are the reason the trials ramped the dose slowly and quoted two versions of the result. They are also why medical supervision sits at the center of the real studies. For the full breakdown of what showed up and how it tracked with dose, our retatrutide side effects guide walks it step by step.
What happens to results after stopping?
This is the part the headlines skip. Retatrutide, like the rest of the GLP-1 class, works while it is in the body. As it clears, appetite tends to return. In research on this class, some regain of lost weight is common once the drug stops, if nothing else changes. The loss is not a one-time fix; it is tied to continued signal. This is reported class information, not medical advice.
That is why the trials, and the field, treat these drugs as long-run tools rather than short courses. The results that make the news came from many months of continuous dosing. A short run gives a short result. It is a fair thing to factor in when reading any before-and-after: the question is not only how much came off, but whether it stayed off, and under what conditions.
What are the limits of this data?
Strong results still have edges, and reading them well means knowing those edges. Retatrutide is mid-to-late in its trials, not decades into real-world use. Some of the biggest single numbers come from the taken-as-planned view or from extensions in selected subgroups. Long-term safety and hard outcomes are still being studied. This is honest research context, not a discouragement.
- It is a study drug, not an approved medicine, and not for human use here.
- The largest figures often reflect people who stayed on the top dose.
- Long-term safety and heart-outcome data are still in progress.
- Individual response varies widely around the average.
None of this shrinks the headline. It just frames it. The weight loss was real, large, and repeated across several trials and groups. The honest move is to hold both facts at once: the results were remarkable, and the picture is still filling in. That is exactly why the compound is supplied for research and not sold as a treatment.
Where does retatrutide go from here?
The phase 3 TRIUMPH program is the last big step before a regulator can weigh in. As the core trials read out with strong results, the next stage is a formal review by agencies like the FDA, which takes time. Until that happens, retatrutide stays investigational everywhere. This is general context, not a forecast of any approval date or outcome.
For anyone reading results today, the practical point is simple. The numbers are from trials, and the drug is not yet an approved medicine. That gap is why the research-supply market exists and why purity and identity matter so much. A result only means something if it came from a known compound at a known dose, whether in a trial or in a lab.
- The pivotal phase 3 trials have read out with large weight loss.
- Formal regulatory review is the next step and takes time.
- Retatrutide remains investigational and research-use-only for now.
- The long heart-outcome trial runs for years beyond the weight trials.
Why the vial changes the whole results picture
Every number on this page came from trials that used a known, pure compound at a known dose. That is the hidden variable in any result. If a vial is underdosed, degraded, or not even the right peptide, the result it produces means nothing, because you cannot tie it back to a real dose. Purity and identity are not fine print. They are the foundation the numbers stand on.
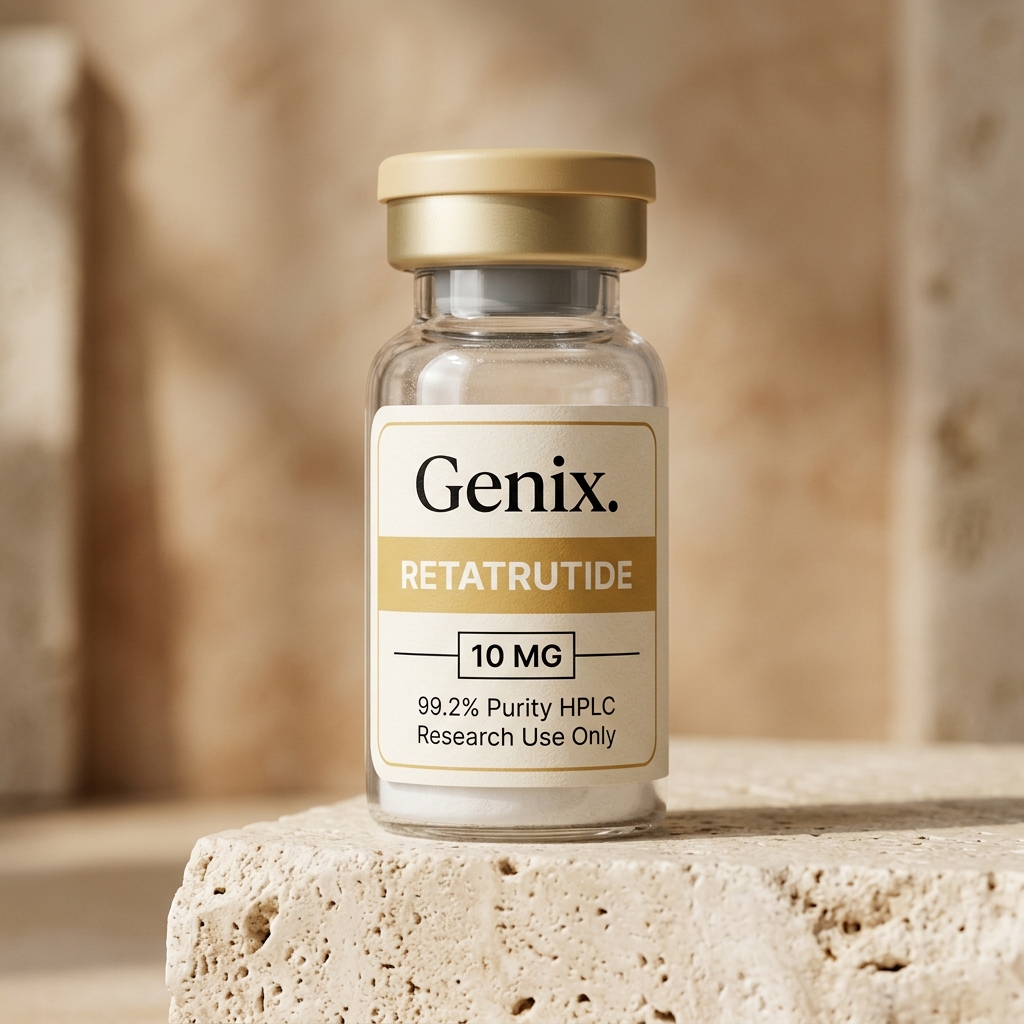
This is where the research-supply side matters. Genix Labs publishes a batch Certificate of Analysis for retatrutide, with HPLC purity at or above 99% and LC-MS identity confirming the compound is what the label says. Cold-chain handling protects it in transit, and in Bali same-day delivery keeps it cold to the door. None of that is a health claim. It is what makes a result reproducible.
The pricing is plain too. Retatrutide runs $109 for the 5 mg starter vial (Rp1.700.000) and $189 for the 10 mg best-value vial (Rp3.000.000). For how that maps to a long research run, our retatrutide cost per mg breakdown does the math. To see the current batch and its COA, visit the lab-tested retatrutide catalog page.
Retatrutide results FAQ
How much weight can I lose in 4 weeks on retatrutide?
In the trials, the first four weeks used the lowest starter dose, so weight change was small, often a few percent. The design keeps the early dose low on purpose to settle the stomach. The large numbers came over many months, not the first month. This is reported research, not a protocol for human use.
How quickly do you see results with retatrutide?
Appetite tends to quiet within the first days in the studies, and the scale usually starts moving in the first few weeks. Meaningful loss builds over 24 to 80 weeks, and in phase 2 the curve had not flattened by week 48. Results are slow and steady, not overnight. Research information only.
Does retatrutide burn fat?
Yes, the data points that way. Retatrutide adds a glucagon target that raises energy use and helps mobilize fat, on top of the appetite effect. Body-composition scans in the studies showed the loss was mostly fat mass. A liver-fat sub-study saw large drops in liver fat too. This is research data, not medical advice.
Does retatrutide get rid of water weight?
A small early dip can include some fluid, as with any fast change. But the sustained loss in the trials was mostly fat, shown by body-composition measurement, not water. The scale kept falling for months, which water loss alone cannot explain. This is reported trial data, not a prediction for any person.
What were the retatrutide phase 3 clinical trial results?
In the phase 3 TRIUMPH-1 obesity trial of over 2,300 adults, mean weight loss at 80 weeks reached about 25% to 28% at the top dose, versus roughly 2% to 4% for placebo, depending on how it was measured. An extension pushed some participants to about 30%. Research use only.
What are retatrutide results at 1 month?
Around one month, participants were still climbing through the low starter doses, so the average loss was modest, often in the low single digits of percent. The value of the first month in the studies was tolerance and appetite change, which set up the larger loss later. This is general research information.
The takeaway
Retatrutide produced the biggest weight-loss numbers any single obesity peptide had reported: about 24% at the top dose in phase 2 over 48 weeks, and the high 20s in the phase 3 TRIUMPH readout over 80 weeks, reaching up to about 30% in an extension. Nearly everyone at the top dose cleared 10%, the loss was mostly fat, and liver fat fell by more than 80% in a sub-study. It built slowly over many months without a clear early plateau.
The honest framing is that these are trial results on a study drug, not a promise for any person, and not a protocol for human use. Results depend on dose, on time, and on the compound actually being pure and correctly identified. That last part is why a batch Certificate of Analysis is the quiet thing that makes any result meaningful. Everything here is for research use only.